
What does USDA Plant Hardiness Zone Mapmean?
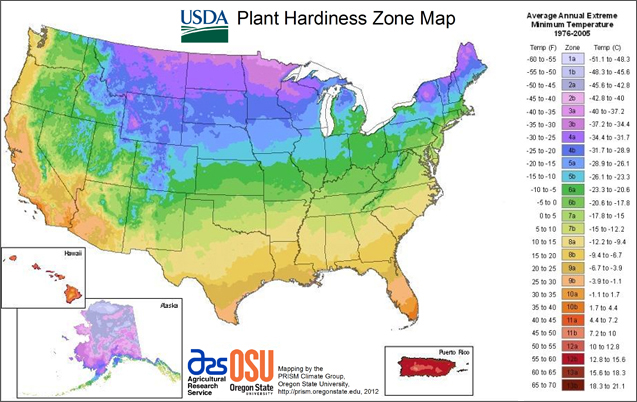
The USDA Plant Hardiness Zone Map has become the go-to fountain of knowledge for gardeners to determine which plants will grow in their specific region. The map divides the United States into 11 distinct planting zones.
The determination for the map’s zone borders is regional temperature. Each border of the map is 10°F warmer (or colder) during an average winter than the adjoining zone. Most gardening catalogs, gardening websites, nurseries, and stores that sell plants specify which zone the plant will grow and thrive within.
More on USDA Plant Hardiness Zone Map
The history of the USDA Plant Hardiness Zone Map can be traced back to the Great Depression when the National Arboretum and researchers at the Arnold Arboretum both started developing maps to help farmers determine what crops would grow in their specific area of the country.
In 1938, the Arnold Arboretum released its map. However, the National Arboretum did not release their map until 1960. The National Arboretum’s map quickly became the favorite and became the USDA Plant Hardiness Zone Map that is in use today.
In 1965, the map underwent a major revamp. The map was further updated four more times throughout the years. The last update was done in 2012.
For a gardener’s reference, there are state, regional, and national images of the map that can be downloaded from the Internet and printed in a variety of sizes and resolutions. In addition, the map is also available online as an interactive, GIS-based map.